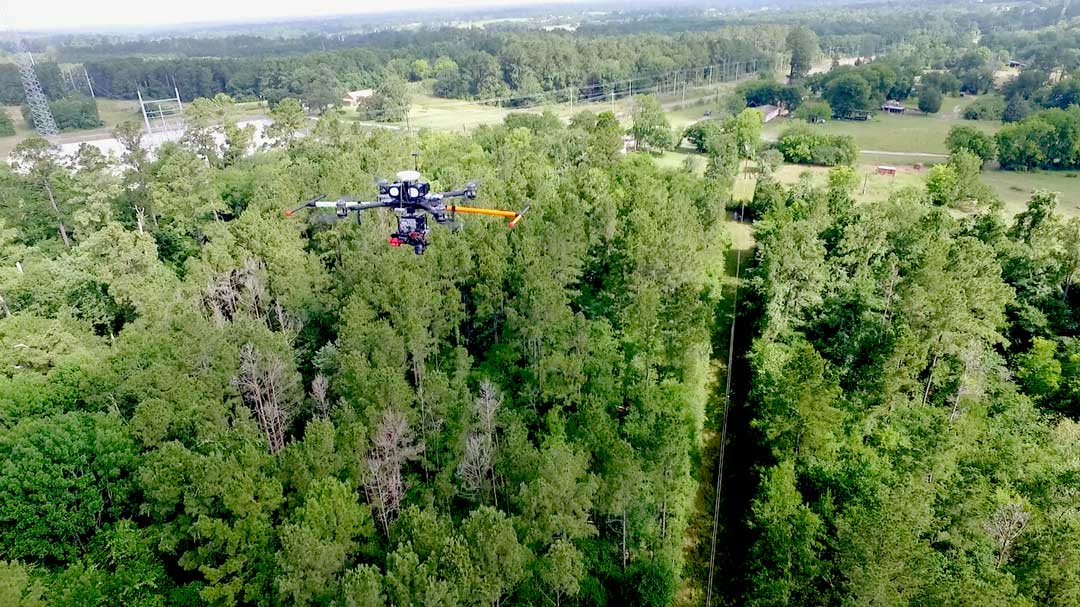

Mid-South Synergy uses unmanned aerial vehicles to identify clearance violations and hazard trees.
As seen in Transmission & Distribution World, March 9, 2017.
Using this two-pronged approach of GIS and previously established cycles, the coop cut down more than 60,000 dead trees close to distribution lines over a three-year period, resulting in a significant decrease in vegetation-related outages to the coop’s pre-2012 levels. This also resulted in a significant drop in the number of dead-tree-related customer calls, as the trees were being cut down before the customers had time to call in and alert the coop.
Although the GIS-derived results went a long way to improving the hazard tree control effort at Mid-South Synergy, the coop thought there was still room for improvement. In as much as the coop’s GIS model gives general possible locations of dead trees, the method is not foolproof. The model lacks the ability to pinpoint the actual location of a dead tree or hazard tree. If known, this ability would go a long way to reducing the number of truck rolls, because crews would be dispatched only to specific areas where hazard trees are present. The model also does not have the ability to determine the distance between hazard trees and distribution lines, or to help to determine vegetation height.
Better Information Needed
Vegetation health – and whether a tree is dead or alive – is another crucial piece of information the coop believes will go a long way in its vegetation management efforts. Without sending a truck roll, Mid-South Synergy wanted the ability to identify the following issues:
- Trees growing within the right-of-way that pose clearance
- Trees growing outside the right-of-way that could contact the distribution lines if they fell, causing an outage and resulting in mechanical damage or triggering a fire.
- Trees within and outside of the right-of-way that are dead and need to be cleared as soon as possible.
- Trees that are overhangs and could fall on power lines.
These four missing pieces of the puzzle could help to take the guesswork out of any vegetation assessment, which the cooperative thought was currently subjective, inconsistent, costly and inefficient.
Drone Ability
An unmanned aerial vehicle (UAV ) or drone flying at a low altitude of 200 ft (61 m) can capture high-resolution images of overhead distribution lines if mounted with the right camera. If equipped with light detection and ranging (LiDAR), vegetation height antd the distance of vegetation from the distribution conductors under all operating temperatures and conditions can be determined from the acquired point cloud data. Attaching a multispectral camera to the drone allows for capturing data in the visible as well as near-infrared and infrared bands of the electromagnetic spectrum. This data can be used to determine vegetation health using the Normalized Difference Vegetation Index (NDVI).
Dead or Alive
NDVI is a standardized index that takes advantage of the contrasting characteristics of two bands from a multispectral raster data set: the chlorophyll pigment absorptions in the red band and the high reflectivity of plant materials in the near-infrared band. The index outputs an image showing greenness or relative biomass.
NDVI values range from -1.0 to 1.0 with negative NDVI values being generated from clouds, water and snow; values near zero are mainly generated from rock and bare soil. Very low NDVI values (<0.1) correspond to barren areas of rock, sand or snow; moderate values (0.2 to 0.3) represent shrub and grassland; and high values (0.6 to 0.8) indicate temperate and tropical rainforests.
Drone Pilot
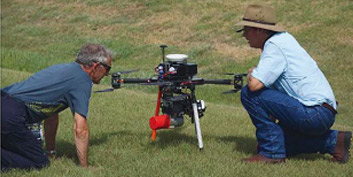
In collaboration with McCord Engineering, an engineering consultancy firm that handles the design for all of the cooperative’s work plan jobs, Mid-South Synergy embarked on a pilot project to test the effectiveness of using a drone to capture data for vegetation management (among other things). McCord Engineering had already been flying the drone to collect engineering line design specific data.
The drone was mounted with a LiDAR sensor and multispectral camera to capture true-color aerial imagery, LiDAR (-500 points m-2) and NDVI (green, red, red edge and nearinfrared bands) on the same flight. The data was then post-processed for location correction using known and established ground control points or landmarks. Mosaics were created from the true-color and NDVI imagery, and further visualization and image analysis was done in Esri ArcGIS 10.5 software.
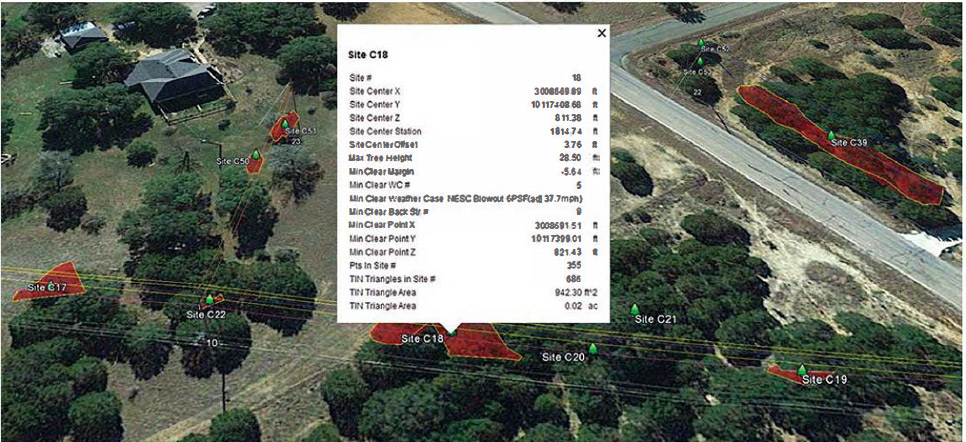
Using PLS-CADD developed by Power Line Systems Inc. (PLSi), the newly collected LiDAR point cloud data was used for 3-D overhead line engineering and vegetation modeling. PLS-CADD calculates the various positions of the distribution wires in all operating and weather conditions, and finds vegetation encroachments to those positions. The vegetation deliverable out of PLS-CADD contains the following important attributes:
- Vegetation height
- Distance of vegetation from conductor positions
- Vegetation that has potential to fall onto distribution lines
- Number of points in a polygon of interest and its area
- NDVI values are referenced.
Results and Use
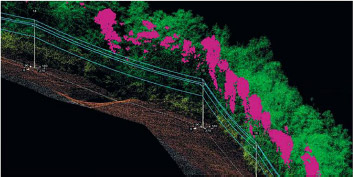
PLS-CADD locates vegetation that has encroached on the utility’s ROW as derived from LiDAR point cloud data. Armed with this information, crews are dispatched to dear vegetation at specific areas.
Because of the massive number of violations in the LiDAR point cloud, PLSi recently added a feature to PLS-CADD to group all of them intelligently into a single work site for each violation region. This is actionable information the coop has just started to use. Crews now know the exact work sites where they need to cut down trees or trim vegetation within the utility’s ROW. This work site data can be exported for use in the GIS along with relevant information about each work site such as geographical location, vegetation height and area of vegetation.
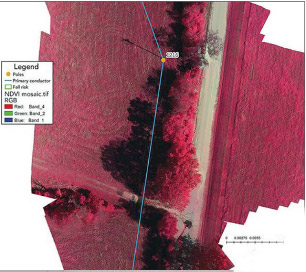
Color infrared images display an object’s reflectivity or, conversely, its absorption of infrared light, making them an incredibly valuable tool to show the health and density of vegetation. In some cases, analysis indicates there is vegetation right around the coop’s primary conductor. Without LiDAR data exposing the height of the vegetation, it may be easy to assume the vegetation is in the utility ROW or is hazardous, which it really is not.
In NDVI images, the lighter colors represent healthy vegetation, while the dark colors represent stressed or dead vegetation. Analysis can show an overlay of NDVI and tree fall risk indicated as colored polygons. Even healthy trees outside the coop’s ROW can pose a risk to lines in the event they fall.
Combining LiDAR with NDVI
LiDAR point cloud data enables the computation of the distance and height values needed to determine clearance violations as well as whether vegetation will fall on conductors or not. With highresolution 2-D imagery that does not have height information, it is not possible to differentiate between vegetation that poses a risk to the conductors from non-risky vegetation. Once NDVI data was added to LiDAR, the cooperative managed to know the vegetation condition and, hence, was in a position to make a more educated call on whether a tree had the potential to fall onto the conductors.
While visually inspecting true-color images for dead trees can be done, it is highly subjective and can be reasonably done only for a small study area. NDVI data simplifies the process, enabling larger areas to be studied and consistent results to be yielded.
A Successful Project
The pilot project was successful in yielding data that helped Mid-South Synergy to identify clearance violations and hazard trees close to the conductors. The cooperative has already started to use data from the pilot project to dispatch crews to areas where hazard trees need to be cut down and trimming needs to be done to maintain a clear utility right-of-way. Without the data from the UAV, the coop would still be sending out crews to general locations where there may or may not be hazard trees, hence the possibility of unnecessary truck rolls.
Because McCord Engineering is flying the UAV to collect Li DAR data to carry out engineering modeling for Mid-South Synergy’s work plan jobs, the annual cost of the cooperative’s work plan decreased by 5%. This is because data is being collected faster and there are fewer hours in the field.
Mid-South Synergy will maintain its clearance cycles but will also include LiDAR and NDVI on each of the feeders that are part of the annual work plan projects being done by its engineering consultant. This will help the cooperative to address hazard trees as soon as possible while maintaining its trimming cycles.
Future overhead line inspection will be augmented by high resolution images that enable asset inspection to be done without going to the field. There is an opportunity for the coop to reduce its overhead inspection cost by using data derived from the drone flights. Geotagged asset photos are easily incorporated into the coop’s GIS. Also, GIS data such as utility poles and conductors can be mapped accurately and incorporated seamlessly into the cooperative’s GIS. It is also expected, once the line-of-sight requirement for UAV operation is lifted, that the coop can benefit from drone flights for damage assessment In this case, the drone can fly in inaccessible areas or areas that may be dangerous for crews to go, especially after a storm.
Acknowledgment
The authors would like to acknowledge the help and collaboration of Otto Lynch of PLSi.